Best Altcoins To Buy Now For Short-Term and Long-Term Gains as Crypto Market Rebound


The cryptocurrency market rose 1.32% over the last 24 hours, rebounding from a 3% weekly dip in the process. A combination of regulatory tailwinds and speculative derivatives activity drove this positive momentum.
According to CoinMarketCap data, the Altcoin Season Index (ASI) currently stands at 36/100, suggesting that altcoins are lagging behind Bitcoin. Despite experiencing minor setbacks through liquidations and ETF outflows, BTC controls 60.87% market share, while the ASI remains firmly within Bitcoin Season territory.
On August 5, the US Securities and Exchange Commission (SEC) clarified that liquid staking tokens (LSTs) are not considered securities assets, thereby resolving a key regulatory overhang. The agency’s new guidance removes legal uncertainty for the $24 billion crypto staking sector.
Meanwhile, Binance processed $100.7 billion in futures trading volume on August 6, with altcoins accounting for 71% of the share, the highest level for the digital asset class since February. While major alts have underperformed against Bitcoin, tap-to-earn (+9.45%) and microcap (+88.55%) tokens managed to soar, indicating that alt rallies remain fragmented as traders chase niche narratives rather than broad sector rotation.
Our pick for today’s best-performing altcoins are MemeFi ($MEMEFI), Velvet ($VELVET), Spell Token ($SPELL), Toshi ($TOSHI), and Mantra ($OM). We have classified these tokens based on their long-term and short-term ROI potential, providing you with a current market analysis and potential price points they could reach in the future.
Best Altcoins You Can Buy Now For Short-Term Gains
|
Token |
Category |
Current Price (08/07) |
24H Change |
Short-Term ROI (2025) |
Long-Term ROI (2030) |
Key Drivers |
|
MEMEFI |
Short-Term |
$0.004355 |
+290.75% |
-30.12% |
Not projected |
High trading volume, Binance delisting squeeze, overbought RSI |
|
TOSHI |
Short-Term |
$0.0006654 |
+10.35% |
+2.41% |
Not projected |
Binance Alpha airdrop, Base chain affiliation, bullish volume |
|
VELVET |
Short-Term |
$0.07611 |
+66.5% |
+39.26% |
Not projected |
Binance futures listing, AI narrative, investor backing |
|
OM (Mantra) |
Long-Term |
$0.2706 |
+2.96% |
+1.09% |
+647.93% |
$20M institutional investment, RWA trend, technical support |
|
SPELL |
Long-Term |
$0.0005590 |
+15.59% |
+555.48% |
+285.70% |
Volume spike, Fib breakout, DeFi rebound, high liquidity |
1. MemeFi ($MEMEFI)
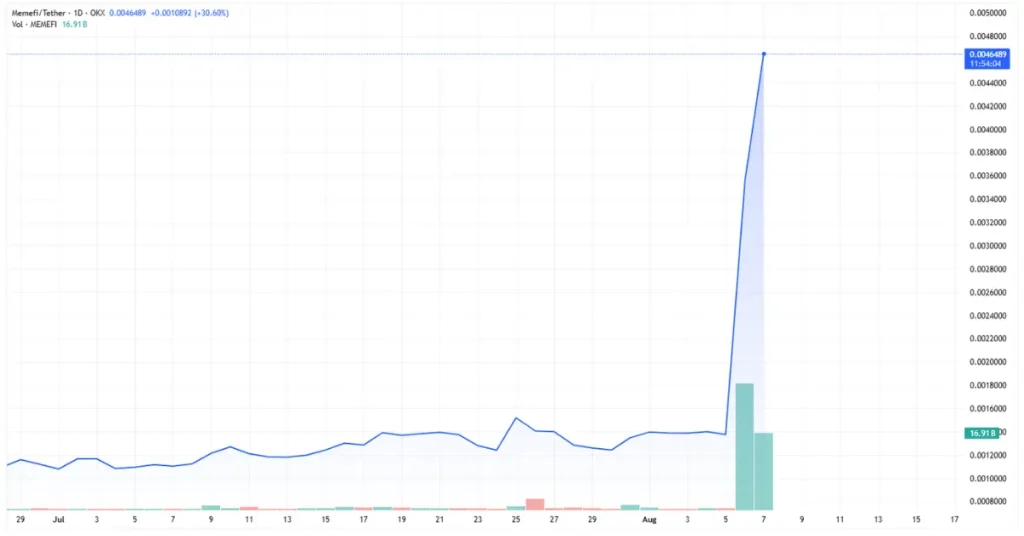
MEMEFI, the reward token of the Telegram-based tap-to-earn crypto game MemeFi, has seen its price surge 181.5% in the last 24 hours, marking its biggest single-day gain since July. This rally was fueled by an explosion in trading volume and mixed market signals. While the overall crypto market rose 1.3%, MEMEFI grew 140x that rate. Experts suspect that the recent pro-crypto reformation from CFTD may be the reason behind the surge in crypto market.
MemeFi’s 24-hour trading volume hit $286.6 million, a whopping 5,020% spike from previous levels, with a 7.21x turnover that even surpassed Bitcoin’s 0.03x ratio, indicating extreme liquidity.
Typically, high-volume breakouts in memecoins often lead to short-term rallies, as seen when MEMEFI maintained its price above the 200-day EMA at $0.0022. However, with 92% of its circulating supply changing hands in the last 24 hours, volatility risk remains in hindsight.
There was also a mixed signal, stemming from Binance’s announcement that the exchange will be delisting MEMEFI perpetual contracts on August 11, forcing leveraged traders to close their positions. While this was initially bearish, the move may have triggered a short squeeze for the token, with open interest dropping 2.37% as traders exited derivatives for spot markets. MEMEFI’s spot price has disconnected from futures premiums, creating a ‘gamma squeeze’ scenario that is common before contracts expire.
The 7-day RSI for MEMEFI hit 95.25, its most overbought level since April, when the price crossed the 23.6% Fibonacci retracement at $0.00341. While the breakout above the 200-day EMA at $0.0022 is technically bullish, an extremely high RSI historically precedes a 30-60% price correction within 72 hours for the token, and the MACD divergence suggests weakening momentum. The next key support level for MEMEFI is the 38.2% Fibonacci level at $0.00297, and failure to hold this position could trigger profit-taking toward the $0.0025 support.
At the time of writing, MemeFi ($MEMEFI) is trading at $0.004355, up 290.75% in the last 24 hours.
MEMEFI Short-Term Price Prediction
In 2025, MEMEFI is anticipated to change hands in a trading channel between $0.002559 and $0.003901, with an average annualized price of $0.002891. This could result in a potential return on investment (ROI) of -30.12% compared to its current market price.
Keep in mind that the prices are subject to MemeFi’s market performance.
| MONTH | MINIMUM PRICE | AVERAGE PRICE | MAXIMUM PRICE |
| Aug 2025 | $0.002608 | $0.003017 | $0.003901 |
| Sep 2025 | $0.002866 | $0.002979 | $0.003093 |
| Oct 2025 | $0.002816 | $0.002924 | $0.003066 |
| Nov 2025 | $0.002559 | $0.002737 | $0.002883 |
| Dec 2025 | $0.002729 | $0.002796 | $0.002874 |
2. Toshi ($TOSHI)
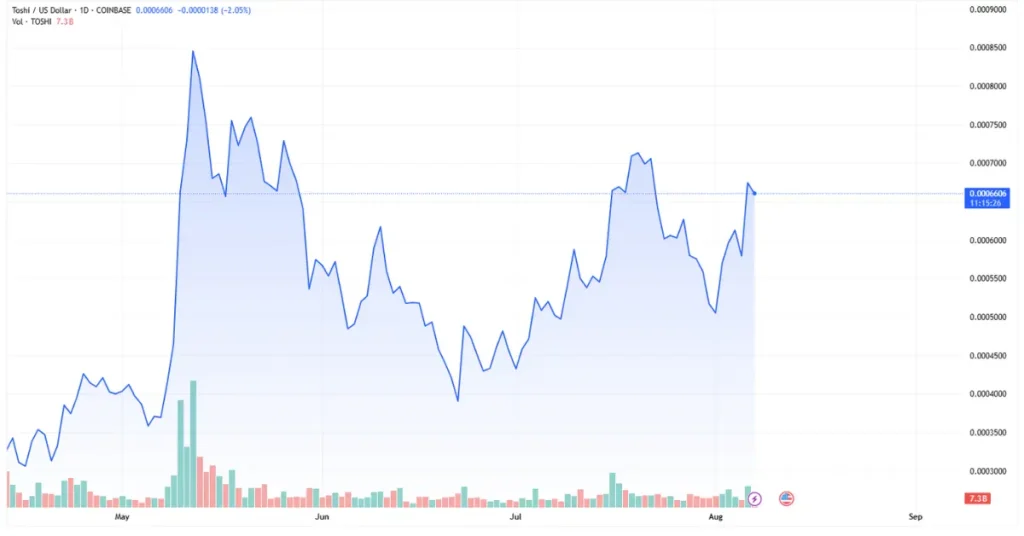
$TOSHI, the community-driven memecoin inspired by Coinbase co-founder Brian Armstrong’s cat, rose 16.16% over the last 24 hours, outpacing the broader crypto market’s 1.5% gain in the same period. Its rally was driven by resilience amid a market-wide selloff during the weekend, a technical breakout above key resistance levels, and the aftermath of the Binance Alpha token airdrop.
Toshi defied the crypto market’s downturn over the weekend, making significant gains while major assets like Ethereum (ETH) and Solana (SOL) fell. The memecoin’s 24-hour trading volume surged 127.7% to $43 million, signaling strong ongoing demand.
Memecoins often decouple during periods of extreme volatility as traders rotate capital to high-beta plays, but TOSHI’s $278 million market cap and affiliation with the Base blockchain provided it with relative stability against its much smaller peers. Its weekend gains have likely attracted momentum traders as the market stabilized.
Binance Alpha airdrop of 69,349 TOSHI per user, between August 1 and 2, created a mixed signal for the token. While the initial claims caused volatility, it turns out the recipients may be holding rather than selling the tokens. Reduced selling pressure suggests growing confidence in the Toshi ecosystem, as Binance’s endorsement has boosted credibility for the Base chain memecoin. However, if demand wanes, then TOSHI’s 420 billion circulating supply could create persistent inflationary risk.
TOSHI cleared the 38.2% Fibonacci retracement at $0.000657 and is trading above its 7-day SMA at $0.00058. Its MACD histogram has turned positive, while the RSI at 60.4 is well below the overbought threshold. This breakout has invalidated short-term bearish scenarios, with rising trading volume and the 15.5% liquidity ratio ($43 million turnover vs $278 million market cap) confirming bullish momentum.
If the positive momentum can hold, then the next resistance level for TOSHI is the 50% Fibonacci level at $0.000725.
At the time of writing, Toshi ($TOSHI) is trading at $0.0006654, up 10.35% in the last 24 hours.
TOSHI Short-Term Price Prediction
In 2025, TOSHI is anticipated to change hands in a trading channel between $0.000463 and $0.000673, with an average annualized price of $0.000514. This could result in a potential return on investment (ROI) of +2.41% compared to its current market price. Keep in mind that the prices are subject to Toshi’s market performance.
| MONTH | MINIMUM PRICE | AVERAGE PRICE | MAXIMUM PRICE |
| Aug 2025 | $0.00047 | $0.000454 | $0.000673 |
| Sep 2025 | $0.000511 | $0.000528 | $0.000546 |
| Oct 2025 | $0.000503 | $0.00052 | $0.000542 |
| Nov 2025 | $0.000463 | $0.00049 | $0.000513 |
| Dec 2025 | $0.000489 | $0.00051 | $0.000512 |
3. Velvet ($VELVET)
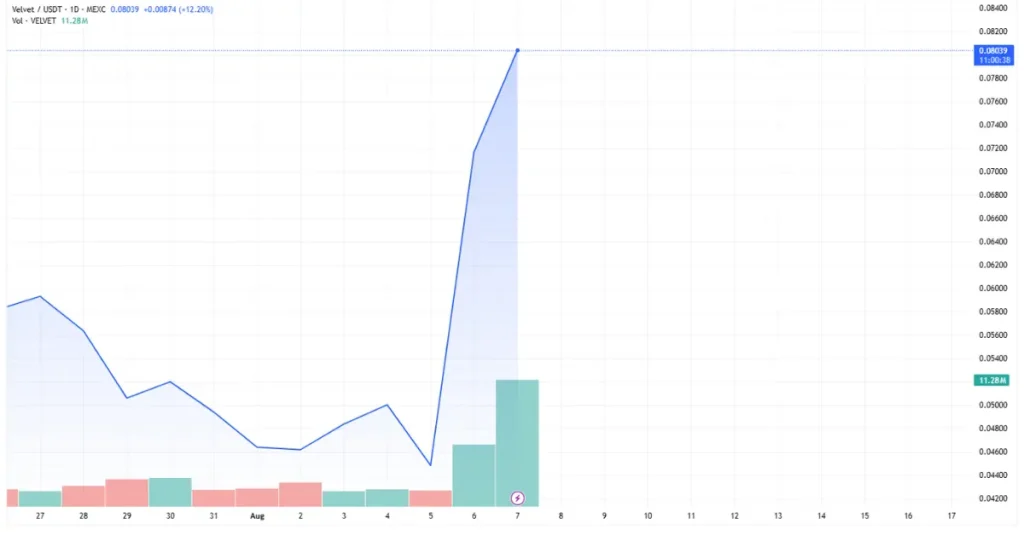
The price of VELVET, the primary asset of the cross-chain, AI-powered, DeFi operating system, Velvet, has surged 66.76% in the last 24 hours, overtaking the broader crypto market’s gain during the same period. The key drivers behind this explosive rally are token listings on major exchanges like Binance, KuCoin, BitMart, and WEEX, and the narrative surrounding its AI-powered OS, which is attracting momentum traders.
Binance launched VELVET/USDT futures contracts with 50x leverage on July 15. In the last 24 hours, derivatives trading volume of Velvet hit $396 million, up 614% from its pre-listing levels, as futures listings on major exchanges typically amplify liquidity and speculative interest in tokens. The 50x leverage option is likely to attract high-risk traders chasing short-term gains, creating upward pressure. Historical data shows that altcoins often experience 40-70% volatility spikes following Binance derivatives listings.
VELVET was listed on KuCoin, BitMart, and WEEX on July 11, following its Token Generation Event (TGE) on the Binance Wallet, thereby increasing its circulating supply to 248 million tokens. While multi-exchange listings can improve a token’s liquidity, they could dilute price momentum.
The initial supply shock created by TGE participants selling their allocations caused a 7.48% dip in Velvet’s price earlier in the day, only to be absorbed by the bullish sentiment. Traders need to keep a close watch on the token’s 2.1x turnover ratio, which indicates high liquidity relative to market cap, and could enable rapid price swings both ways.
The AI narrative has helped boost Velvet’s prospects, as AI-related tokens have outperformed BTC by 89% year-to-date. The surge was also supported by the $3.7 million investment made into the project by an ex-Binance Labs investor, adding more credibility for VELVET. The token’s 7-day RSI hitting 69.68 suggests overheating conditions. Traders should make sure that the open interest (OI) for VELVET, currently at $3.6 billion, sustains its positive momentum, as a decline could signal profit-taking.
At the time of writing, Velvet (VELVET) is trading at $0.07611, up 66.5% in the last 24 hours.
VELVET Short-Term Price Prediction (Aug – Dec 2025)
In 2025, VELVET is anticipated to change hands in a trading channel between $0.08121 and $0.108412, with an average annualized price of $0.087926. This could result in a potential return on investment (ROI) of +39.26% compared to its current market price. Keep in mind that the prices are subject to Velet’s market performance.
| MONTH | MINIMUM PRICE | AVERAGE PRICE | MAXIMUM PRICE |
| Aug 2025 | $0.082202 | $0.090487 | $0.108412 |
| Sep 2025 | $0.087423 | $0.089727 | $0.092021 |
| Oct 2025 | $0.086412 | $0.088599 | $0.091485 |
| Nov 2025 | $0.08121 | $0.084811 | $0.087703 |
| Dec 2025 | $0.084651 | $0.086007 | $0.087582 |
Best Altcoins You Can Buy Now For Long-Term Gains
1. Mantra ($OM)
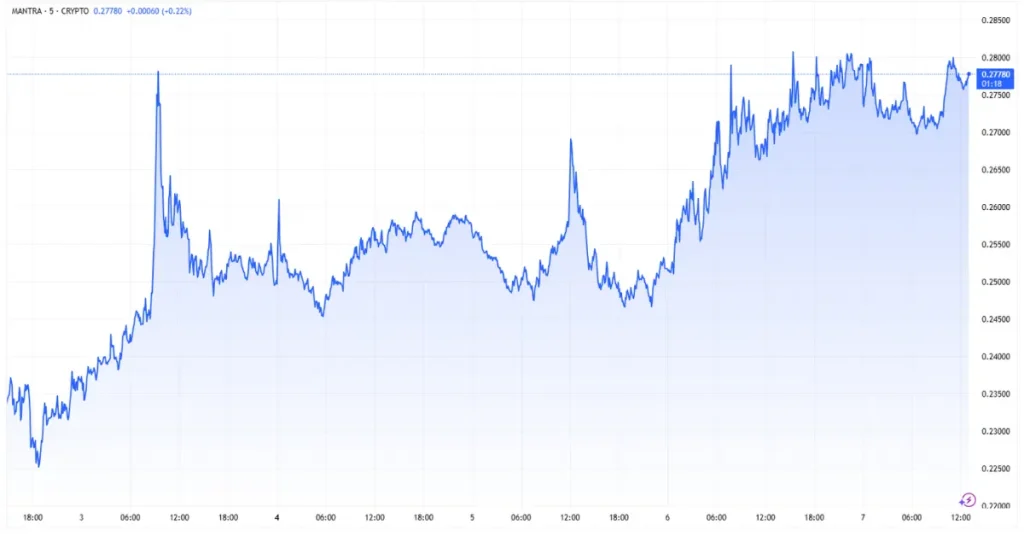
OM, the native token of the Cosmos-based decentralized finance (DeFi) platform and Layer-1 blockchain focused on real-world assets (RWA), Mantra, rose 0.91% over the last 24 hours, building on its 5.78% weekly and 33.7% monthly gains. The key catalysts behind its rally are a mix of strategic partnerships, technical price breakouts, and RWA sector growth.
On August 5, Iveniam Capital Partners, a decentralized data infrastructure provider for private assets, invested $20 million in Mantra to provide RWAs packaged with real-time asset reporting and surveillance to DeFi and institutional capital allocators in Dubai. The direct capital injection and institutional credibility have boosted investor confidence in the compliance-focused L1, which is targeting a piece of the $19 trillion RWA market.
Traders are looking forward to Mantra’s August 7 community call, which likely fueled short-term buying. Furthermore, TVL growth on the blockchain and cross-chain interoperability with Inveniam’s Abu Dhabi operations will be key to its price growth.
OM is currently trading above its critical support level at $0.252 (30-day SMA) and 61.8% Fibonacci level at $0.272. The 14-day RSI at 56.71 suggests neutral momentum, but the token’s MACD histogram remains negative. While the bullish structure is intact with a higher low since July, OM needs to break above its resistance at $0.295 for sustained upside.
Mantra’s $200.6 million 24-hour trading volume confirms trader interest, although the turnover ratio of 0.718 signals moderate liquidity risk. A close below $0.252 could trigger a retracement toward $0.241 at the 78.6% Fibonacci level, while surpassing the $0.295 resistance may target the 38.2% Fib at $0.37.
At the time of writing, Mantra (OM) is trading at $0.2706, up 2.96% in the last 24 hours.
OM Long-Term Price Prediction (2025-2030)
In 2025, OM is anticipated to change hands in a trading channel between $0.2710 and $0.2748, with an average annualized price of $0.2729. This could result in a potential return on investment (ROI) of +1.09% compared to its current market price.
Based on our technical analysis, by 2030, OM is expected to have an ROI of 647.93% compared to its current price. Keep in mind that this prediction is subject to Mantra chain’s growth and the demand for tokenized RWAs.
| YEAR | MINIMUM PRICE | AVERAGE PRICE | MAXIMUM PRICE |
| 2026 | $0.275269 | $0.390642 | $1.05 |
| 2027 | $0.845011 | $1.12 | $1.65 |
| 2028 | $0.63843 | $1.32 | $2.04 |
| 2029 | $0.464229 | $0.535645 | $0.693816 |
| 2030 | $0.527407 | $0.574772 | $0.837918 |
2. Spell Token ($SPELL)
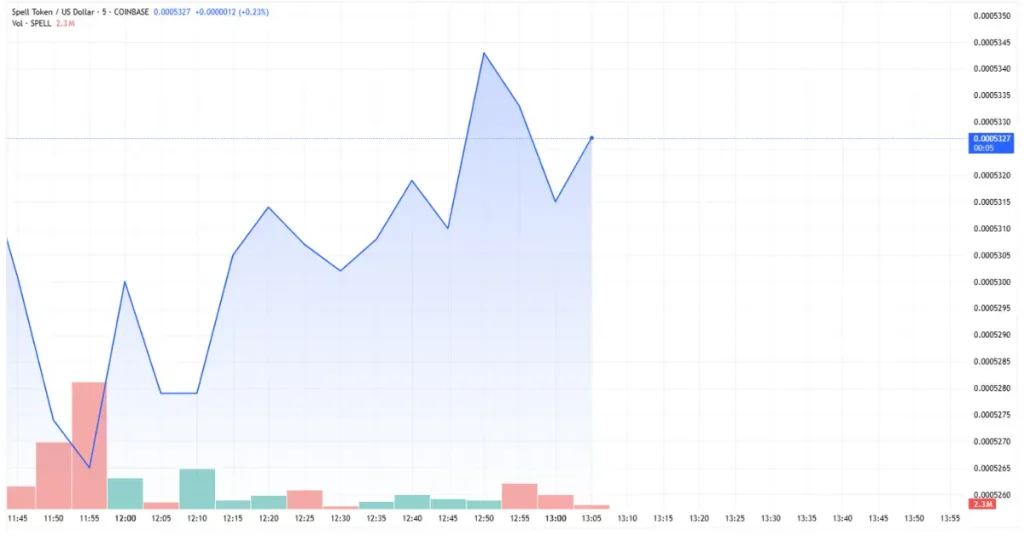
SPELL, the reward token offered by decentralized lending platform abracadabra.money for borrowing its USD-pegged Magic Internet Money (MIM) stablecoin, has surged 21.87% in the past 24 hours, outperforming its 7-day (+10.23%) and 30-day (+24.75%) gains. Its rally coincided with a 1,882% increase in 24-hour trading volume and a bullish breakout above key resistance levels.
Spell’s trading volume exploded to $144.27 million, with a turnover ratio of 1.57x, which indicates high liquidity and confirms bullish conviction. However, such extreme spikes come with potential volatility, which often precedes short-term pullbacks as a profit-taking opportunity arises. The token’s 24-hour volume/market cap ratio exceeds typical DeFi token averages, raising concerns about whether its current rally will be sustainable.
The Fear & Greed Index rating of 54 (neutral) points to reduced systemic selling pressure, while the slight drop in Bitcoin’s market dominance has allowed capital rotation into alts, which could boost SPELL’s prospects. The limited “greed” momentum means that its move upwards relies more on technicals than euphoric sentiment.
SPELL broke past its 61.8% Fibonacci retracement level at $0.0005086, and is currently trading above its 30-day SMA at $0.000512. The positive MACD histogram and the 14-day RSI at 66.52 indicate there is more room for further upside before the token hits overbought conditions.
Breakouts often trigger algorithmic buying and FOMO among traders. Clearing a key psychological threshold at the 61.8% Fibonacci level means that buyers have taken control of the SPELL market from sellers, who dominated earlier price ranges. Sustained close above the 78.6% Fib level at $0.0004805 could accelerate gains toward $0.0006122 – its 2025 high. While Spell’s bullish momentum is intact, the extreme spike in trading volume poses a threat, and traders should watch out for exhaustion signals.
At the time of writing, Spell Token ($SPELL) is trading at $0.0005590, up 15.59% in the last 24 hours.
SPELL Long-Term Price Prediction (2025-2030)
In 2025, SPELL is anticipated to change hands in a trading channel between $0.000528 and $0.003559, with an average annualized price of $0.001563. This could result in a potential ROI of 555.48% compared to its current rate.
Based on our technical analysis, by 2030, SPELL is expected to have an ROI of 285.70% over its current market price. Keep in mind that this prediction is subject to its market performance.
| YEAR | MINIMUM PRICE | AVERAGE PRICE | MAXIMUM PRICE |
| 2026 | $0.000726 | $0.001138 | $0.00217 |
| 2027 | $0.000547 | $0.000827 | $0.002037 |
| 2028 | $0.000634 | $0.001037 | $0.002299 |
| 2029 | $0.000601 | $0.001138 | $0.003332 |
| 2030 | $0.000862 | $0.001211 | $0.002104 |
Final Thoughts
Our picks for today’s best-performing cryptocurrencies – $MEMFI, $TOSHI, $VELVET, $OM, and $SPELL – have registered substantial price gains over the past 24 hours. Their rallies were driven by a mix of capital rotation into small-cap altcoins, exchange listings, speculative trading, and strategic investment.
All five tokens serve varied purposes on the blockchain, from DeFi to GameFi, and RWA to an AI-powered operating system, and have the potential to be excellent choices for short-term and long-term ROI. However, cryptocurrencies are speculative and highly volatile assets; therefore, it is crucial to conduct proper research and seek expert advice before making an investment decision.
The contents of this blog are for educational purposes only and should not be construed as investment advice. When it comes to cryptocurrencies, only invest money that you can afford to lose.

Crypto & Blockchain Expert