What Are Bollinger Bands? A Complete Guide to Using Bollinger Bands in Crypto Trading


Technical indicators help traders analyze the price action and forecast the direction of the market. And among the market indicators, the Bollinger Band is greatly popular and is a mainstream crypto trading approach. But the newbies in crypto trading are still unaware of what exactly the Bollinger Bands are and how they work in crypto trading.
In this article, we will be covering everything you need to know about Bollinger Bands, including how to implement them effectively.
What Are Bollinger Bands
Formulated by John Bollinger in the 1980s, Bollinger Bands is a technical analysis tool that uses price volatility to predict the entry and exit points of trading opportunities. These consist of two peripheral bands and a centerline of moving averages for a period of 20 days. These bands expand and contract in response to the fluctuations in the price levels.
The Bollinger Bands are used to check for price volatility, identify potential reversal points, and make the right decisions while trading.
The upper band is obtained by multiplying the middle band by the price’s standard deviation or the volatility of the price. The middle band typically represents the price of the asset over a specific period of time, as a simple moving average. And the lower band is determined by subtracting the standard deviation from the middle band.
that is,
- Upper Bollinger Band = SMA + (Multiplier x SD)
- Middle Band = (Sum of closing price over the time period) / (Number of periods)
- Lower Band = SMA – (Multiplier x SD)
Uses of Bollinger Bands in Crypto Trading
Bollinger Bands are an important technical analysis tool in crypto trading, which allows traders to:
- Price Volatility Assessment: When the bands widen, it suggests greater market volatility, thereby offering opportunities for trading. On the other hand, a contraction of the bands indicates less volatility and an increased chance of price consolidation.
- Detecting Overbought and Oversold Conditions: Probable overbought and oversold scenarios can be identified with the help of Bollinger Bands. When the price goes beyond the upper band, it indicates an overbought condition with potential selling opportunities. And when the price goes down, reaching the lower band, it can be considered oversold, showing a potential opportunity to make a purchase.
- Trend Direction Determining: The direction of the current trends can be determined by the Bollinger Bands. If the price is consistently moving towards the upper band, it indicates a bullish trend, and a converse situation, with the price moving towards the lower band, may indicate a downtrend.
- Generate Reverse Signals: The potential trend reversals can be identified by the Bollinger Bands through reverse signal generation.
How to Create Bollinger Bands?
With the help of a simple moving average and standard deviation, Bollinger Bands can be created, which provide information about the price volatility and potential opportunities for trading in the crypto market.
- Calculate the SMA, according to the time frame you have chosen for the analysis, such as hourly, daily, etc., according to your trading strategy.
- Calculate the standard deviation of the closing price during the same time frame used to find the SMA.
- Multiply the SMA by the standard deviation to obtain the upper band and subtract the multiple of the SD from the SMA for the lower band.
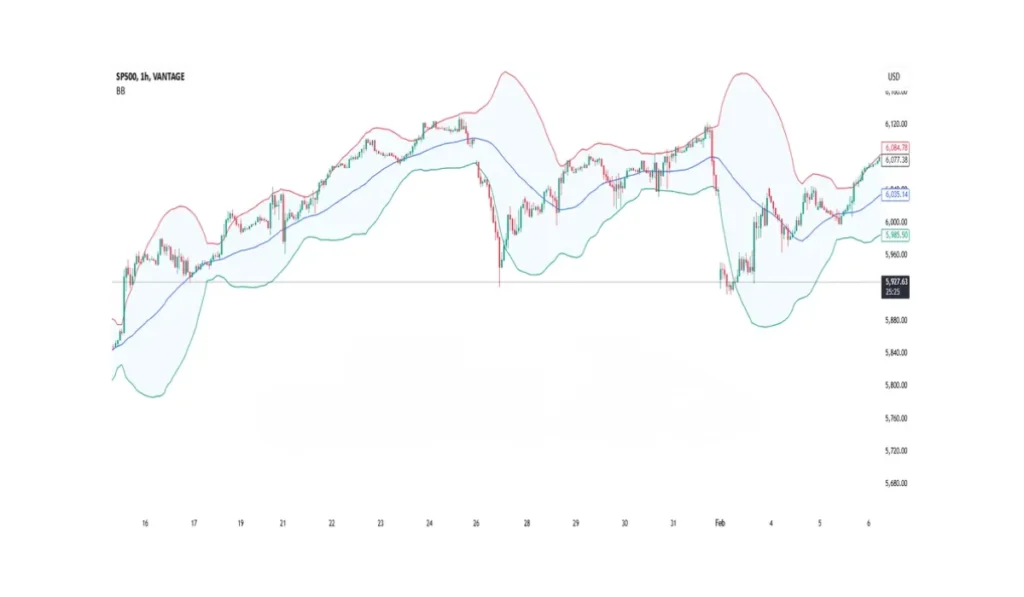
- Plot the Bollinger Bands on the price chart to create a channel for interpretations. A price near the upper band indicates an overbought condition, and near the lower band shows an oversold market.
Strategies Using Bollinger Bands in Crypto
Creating and executing strategies using the Bollinger Bands can help you become a successful trader.
- Bollinger Band Squeeze: When the bands are very close, indicating low volatility, traders can prepare for a breakout in either direction. A heavy volume outside the band points towards the start of a new trend.
- Riding the Trend: In strong bull markets, the prices can move along the top line, indicating strong, continuous buying pressure. In bear markets, the price remaining on the lower band indicates ongoing selling in the market. These indications help the traders from getting off the market prematurely.
- Mean Reversion: Once the price has moved too high or too low, it will return to the middle band, which helps the traders to execute counter-trend transactions, i.e., selling at the top band and buying at the lower band.
- Double Bottoms and Tops with Bands: A double bottom near the lower band, with the second bottom above the first, is an indicator of possible reversal. However, a double top on the upper band points to a weakening momentum.
- Multi-Indicator Confirmation: Traders use Bollinger Bands along with other indicators like RSI or MACD for a stronger signal.
Advantages of Using Bollinger Bands in Crypto Trading
- Bollinger Bands are easy to comprehend, making them beginner-friendly.
- The bands expand and contract with the changes in the volatility, making it extremely sensitive to highly volatile crypto markets.
- As it shows how the prices are reacting to the bands, it allows the traders to spot the trending and ranging markets.
- It can be used for both short-term and long-term trading, making it flexible.
Limitations of Bollinger Bands for Crypto Trading
- Sometimes, Bollinger Bands may generate false signals, especially during periods of low volatility or when the market is fast-paced. These false signals can result in losses.
- Additional indicators or techniques are required to confirm the direction of trend, as Bollinger Bands alone won’t provide all the information about directional shifts.
- The effectiveness of the indicator can sometimes vary based on the coins as well as the time frame followed.
- Unexpected changes in the market can result in price disparities, which may not be reflected in the bands.
Risk Management While Using Bollinger Bands
While implementing the Bollinger Bands, rigorous risk management and analysis are required.
- Explicit stop-loss orders must be set up to reduce any potential losses.
- Position sizing, by designating a certain amount of capital to each trade, can help avoid overexposure.
- Always make sure to use the Bollinger Bands along with other confirmation indicators and market patterns.
- Sustaining discipline and adherence to a particular risk management strategy is necessary.
Conclusion
The Bollinger Bands are a highly helpful indicator used to measure price volatility and seek trading opportunities in the crypto market. The responses offered by the bands shift with the changes in the market conditions, warning about overbought or oversold conditions.
In the crypto market, where volatility is greater than in the traditional markets, Bollinger Bands help traders make informed decisions. However, just as in the case of any other indicators, Bollinger Bands also offer more accurate market information when combined with other tools, such as RSI or MACD. These bands let traders improve the chances of gaining profit in the fast-paced crypto markets.

Crypto & Blockchain Expert