
Key Points
- Bitcoin has dropped below its $105,000 resistance level, and analysts consider the $100,000 level as a critical support zone.
- Bitcoin price today is $104,519.03, exhibiting a 2.66% price drop in the last 24 hours.
- Bitcoin hasn’t traded below $100,000 in around 180 days, and any movement below that could be a crack for BTC’s structural floor, which has been shaped by strong investor confidence.
- Analysts believe that a break below $100K is possible right now, and if that happens, it could trigger a deeper correction to $90,000.
Bitcoin’s price crash today indicates that the world’s largest cryptocurrency by market cap is facing significant market pressure. The US Federal Reserve’s cautious approach to interest rate cuts has diminished market optimism and led to an overall weakening of the crypto sector, including Bitcoin.
According to the latest market analysis, Bitcoin is trading at $104,519.03, below its key support levels.
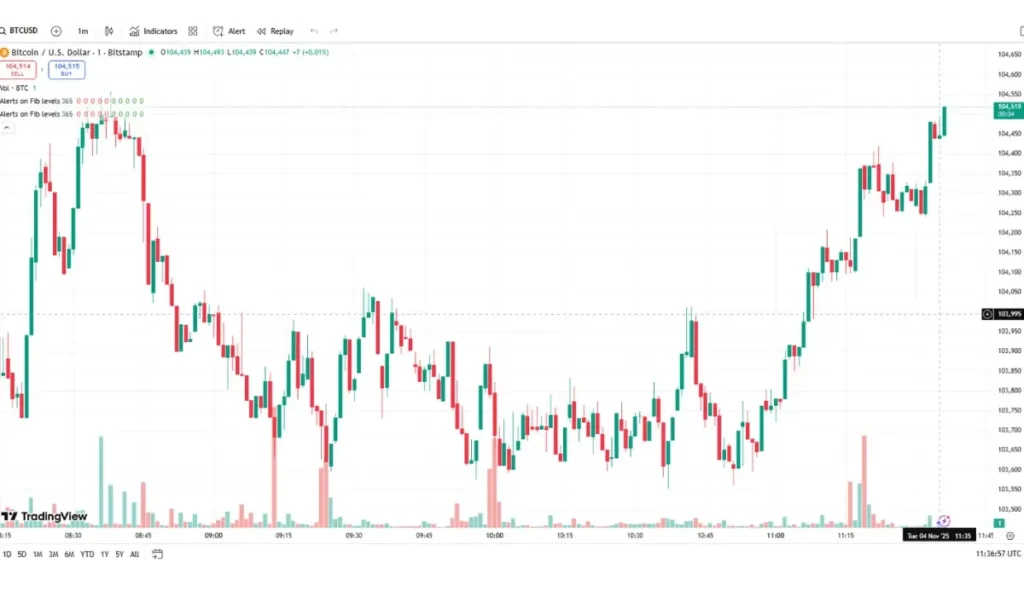
Source: TradingView
BTC suffered a 2.6% price drop in the last 24 hours and exhibited around 9% price decline compared to the previous week.
The bearish sentiment and BTC’s price drop from $110K to $104K have led to a massive liquidation cascade.
According to recent data, over $1.37 billion in crypto positions were liquidated in the last 24 hours. This includes $396M in Bitcoin longs, and it is marked as the largest liquidation event since the October $20 billion crash.
Currently, BTC has broken its critical support at $105K and has been trading below its 30-day SMA ($112,662), and in the near term, BTC has a higher chance of testing supports near $103,500 and probably going below $100,000 if it doesn’t hold on to its current level.
Bitcoin’s historical trends show that November generally delivers the best market performance for BTC, so any chance for a potential turnaround and sudden upward price momentum cannot be ruled out. Crypto analysts opine that BTC’s rebound is still plausible if macroeconomic conditions improve and investor interest is regained. They warn investors to stay alert and to remain cautious about stabilization signs or further weakness, since a movement below $100K could lead to deeper price corrections.
Bitcoin Shows Extreme Fear in the Fear & Greed Index: Will Bitcoin Go Down Below $100K?
As of November 4, 2025, Bitcoin’s Fear & Greed Index score hovers between 21 and 27, indicating “Extreme Fear” in the crypto market. A significant drop from “Neutral” to “Extreme Fear” was mainly catalyzed by the US Federal Reserve’s cautious approach to interest rate cuts. Some analysts believe that BTC selling pressure on crypto exchanges has just hit a new cycle, and the current price drop is not only fueled by heavy selling, but also by a lack of buying.
According to them, a small uptick in demand will change the whole narrative and push BTC’s price back up.
Extreme fear in the market signals market bottoms or oversold conditions, where investors panic and sell their holdings. The ongoing bearish momentum of BTC and its activity below the $105,000 level created high volatility and has eliminated the possibilities of an immediate price recovery. $100,000 is a key support level for BTC, and the price point will have strong investor interest. If selling pressure intensifies and the external factors go against the wind, BTC may fall below $100K. The historical dips below that particular point can be short-term and are likely to be over before buyers suit up.
A technical analysis expert from Block Wave posted on X that BTC was testing its key support zone after rejection from resistance.
BTCUSDT (4H)$BTC is testing its key support zone after rejection from resistance.
— Block Wave (@BlockWave_chart) November 4, 2025
If it breaks below the Monthly Low and closes under $102,000, the price could drop further toward the $95,000 – $96,000 range.
Downside momentum remains strong unless support holds. pic.twitter.com/qBmtZzC8Rx
They noted that if it broke below the Monthly Low and closed under $102,000, the price could drop further toward the $95,000 – $96,000 range. They added that downside momentum remained strong unless support held. Despite the bearish momentum, some analysts still believe in BTC and expect a rebound toward 106-107K.
A crypto expert named Mooncake claimed that a bounce from 106k into the 111.5–112k range had played out, and the price had been rejected at 111.2k.
$BTC
— mooຖ⏾ake (@mooncakexbt) November 4, 2025
we’ve laid out the key levels clearly since last week,
a bounce from 106k into 111.5–112k played out, price got rejected at 111.2k. We've noted as well that if price starts to stall at that level could trigger a breakdown
now, if we drop straight into the 98ks, expect a… https://t.co/t5YGtbwcjr pic.twitter.com/Mf0a4qDoGZ
They noted as well that if the price started to stall at that level, it could trigger a breakdown. They added that if it dropped straight into the 98ks, one should expect a relief bounce toward 106–107k, after which they would reassess.
The Bottom Line
In conclusion, BTC’s strong bearish sentiment and extreme fear in the Fear & Greed Index show that a strong downside caution and possible downward move below $100,000 remains plausible. Historical patterns in November back a possibility for upward momentum, and prevailing macro risks will favor a price recovery. BTC’s short-term risks are inclining toward bearish, oversold conditions, whereas its historical run in November and its bullish bias with an average 25% increase could stabilize its price and eliminate the current BTC downtrend.